Where possible, we want to collect and store data in a tabular format
Each row represents an observation
Each column represents a variable
Each observational unit is a table
Each observation should have a unique identifier where possible
Data Science Workflow
Import: Identify sources and acquire data, utilizing automation whenever possible.
Tidy: Wrangle data into a format conducive for understanding its properties and store it in an accessible location. Performed autonomously whenever possible.
Transform: Extract features of interest from tidy data and perform extra calculations.
Data Science Workflow
Visualize: Generate informative illustrations of the transformed data to provide context to new insights.
Model: Apply statistical methods, machine learning, and artificial intelligence, to understand the data via prediction, identifying trends, and detecting anomalies.
Communicate: Interpret results and produce reports, dashboards, and compelling summaries of findings in a way that is digestible and actionable.
Guiding Questions
Import
What information is necessary to address my questions?
Where can I acquire this information from?
How can this information be collected?
Can this be performed programmatically via web scraping, an API, or an existing package/library?
Must this be performed manually, such as live data collection or a bulk download/export?
How frequently does this information need to be collected?
Guiding Questions
Tidy
How is the information that I am looking to acquire currently formatted?
What pieces of information do I want to retain to convert into a tidy format?
Transform
What metrics should be derived from the collected data?
What subject matter (domain) knowledge is necessary to calculate auxiliary values?
Guiding Questions
Visualize
How should the information be presented visually?
How has the information been visualized in analogous or adjacent use cases?
Model
Will this information be used to predict future outcomes, make inferences on past events, or describe the phenomena taking place?
Guiding Questions
Communicate
Who are my stakeholders receiving the insights generated from this analysis?
What is the most sustainable medium for these insights to be shared?
How often will these insights be shared?
Case Study: Track and Field Performance Rankings
Motivation
Suppose that you are the High-Performance Manager for Athletics Canada, the national sport governing body for track and field, para athletics, cross country, and road, mountain, and trail running. You have two questions:
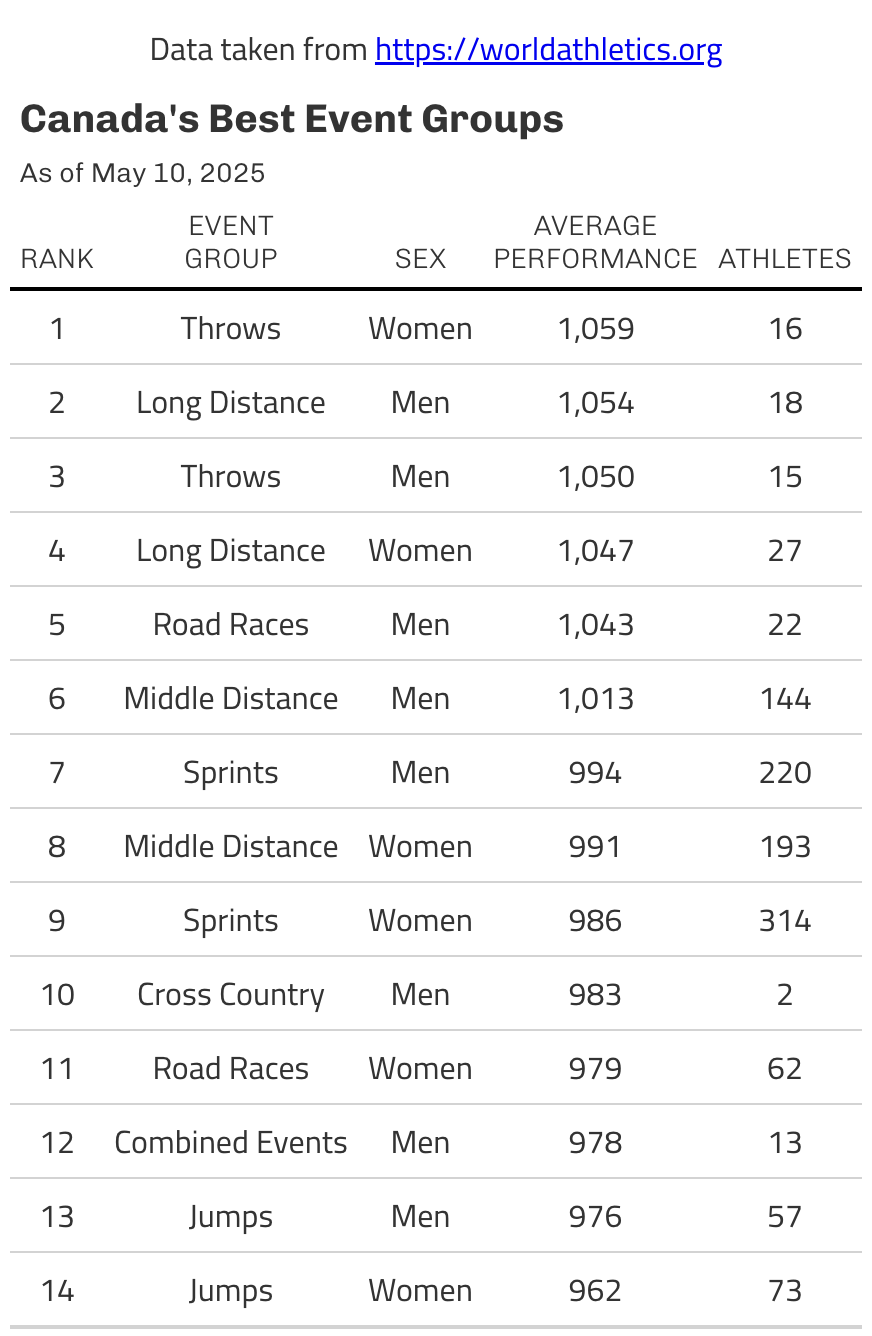
1. “What is our most successful event discipline?”
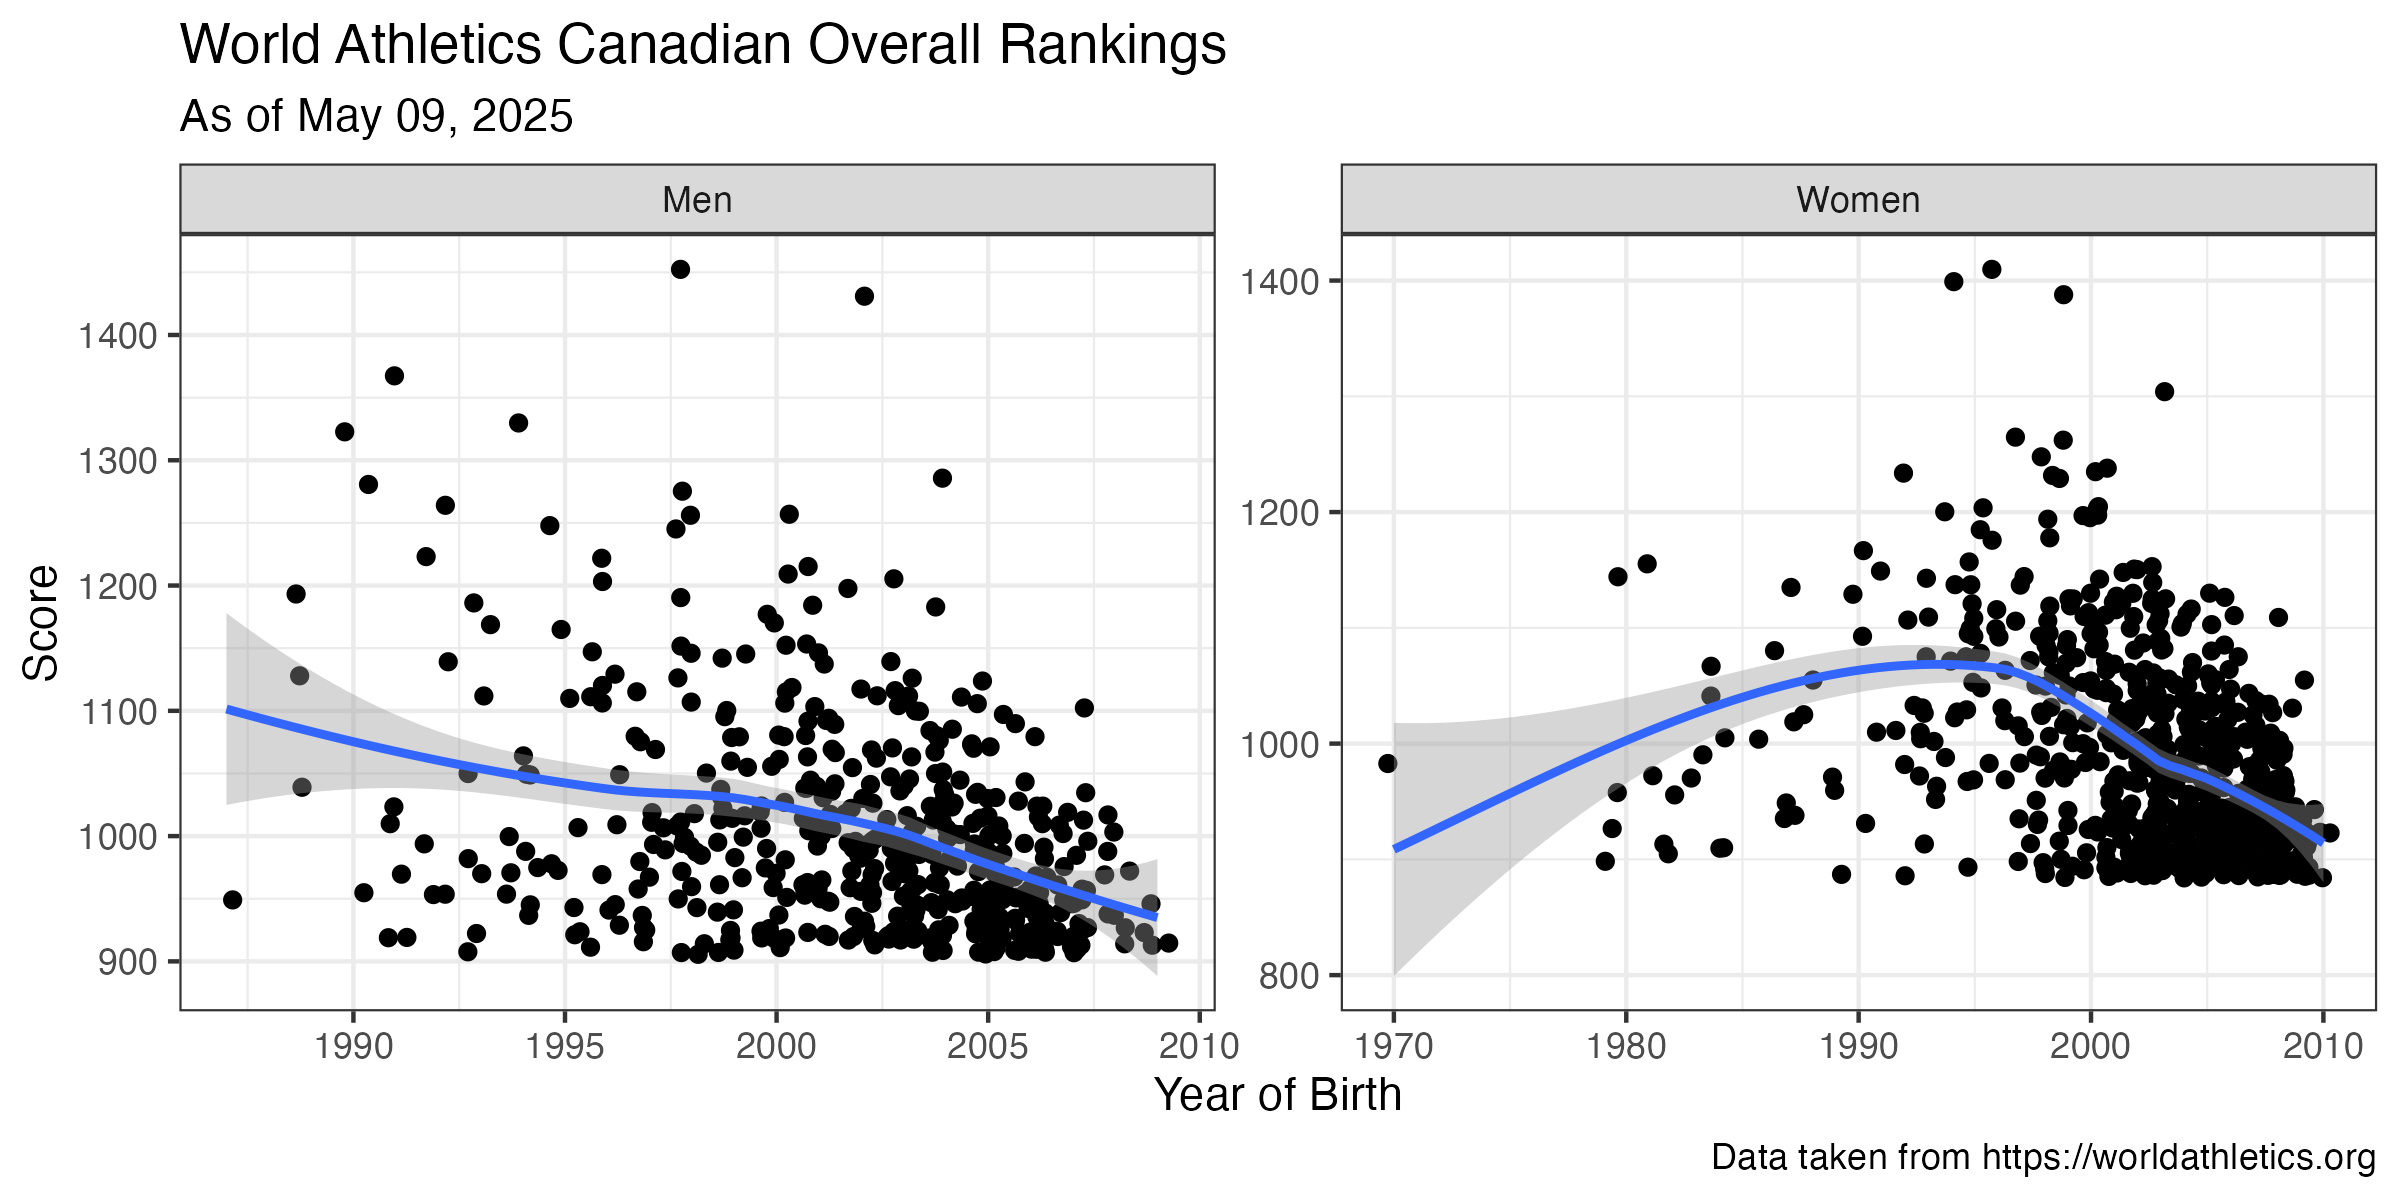
2. “Is there a relationship between our athlete’s performances and their age?”
Step 1: Import
What information is necessary to address my questions?
Where can I acquire this information from?
How can this information be collected?
How frequently does this information need to be collected?
Step 1: Import
What information is necessary to address my questions?
sexes =c("men", "women")all_rankings =list()for (sex in sexes) {# initialize athlete_rankings and page number athlete_rankings =data.frame() page =1# the website is paginated, so we need to loop through each pagewhile(TRUE) { website_url <-paste0("https://worldathletics.org/world-rankings/overall-ranking/", sex, "?regionType=countries®ion=can&page=", page) webpage <- rvest::read_html(website_url)#... continued on next slide
Example Implementation in R
#... continued from previously new_table <- webpage |> rvest::html_table() |># extract the table from the webpage html dplyr::bind_rows() # combine into a single dataframeif(nrow(new_table) ==0) break# this is the end of the table page <- page +1 athlete_rankings <- dplyr::bind_rows(athlete_rankings, new_table) # add new rows to existing rowsSys.sleep(2.5) # Insert pauses so as to not overwhelm a webpage} all_rankings <-append(all_rankings, list(athlete_rankings)) # combine mens and women's results into list}
Tidy
How is the information that I am looking to acquire currently formatted?
What pieces of information do I want to retain to convert into a tidy format?
Tidy
How is the information that I am looking to acquire currently formatted?
Use dplyr::glimpse
What pieces of information do I want to retain to convert into a tidy format?
combined_table <- dplyr::bind_rows(all_rankings, .id ="sex") |> janitor::clean_names() |># format the column names in "snake_case" dplyr::mutate(dob =case_when( stringr::str_detect(dob, "^\\d{4}$") ~as.integer(dob), # if only the year is displayed, preserve it!is.na(lubridate::dmy(dob, quiet = T)) ~ lubridate::year(lubridate::dmy(dob, quiet = T))# if the entire birthdate is diplayed, extract the year ),sex =if_else(sex =="1", "Men", "Women"), # since the men's table was scraped firstevent_list =str_remove(event_list, "\\s\\[.+\\]") # remove "similar events" ) |> dplyr::rename(country = x4, yob = dob) # convert x4 to 'country' and date of birth to year of birth
Transform
What metrics should be derived from the collected data?
What subject matter (domain) knowledge is necessary to calculate auxiliary values?
Transform
What metrics should be derived from the collected data?
Individual events must be aggregated into event groups.
What subject matter (domain) knowledge is necessary to calculate auxiliary values?
An understanding of event group classifications, using either World Athletics regulations or a similar standard.
Example Implementation in R
combined_table <- combined_table |>mutate(event_list =str_replace(event_list, "10,000", "10000")) |># so that the comma isn't caught by `separate_longer_delim`separate_longer_delim(cols = event_list, delim =",") |>mutate(event_group =case_match(event_list,c("100m", "200m", "400m", "400mH", "100mH", "110mH") ~"Sprints",c("800m", "1500m", "3000mSC") ~"Middle Distance",c("5000m", "10000m") ~"Long Distance",c("Heptathlon", "Decathlon") ~"Combined Events",c("High Jump", "Long Jump", "Triple Jump", "Pole Vault") ~"Jumps",c("10km Walk", "10km Road", "20km Walk", "35km Walk", "50km Walk", "Half Marathon", "Marathon") ~"Road Races",c("Cross Country", "XC Senior Race") ~"Cross Country",.default ="Throws"# the rest of the events )) |>add_count(competitor, event_group, name ="n_events") |>slice_max(order_by = n_events, n=1, by = competitor, with_ties = F)
How has the information been visualized in analogous or adjacent use cases?
Visualize
How should the information be presented visually?
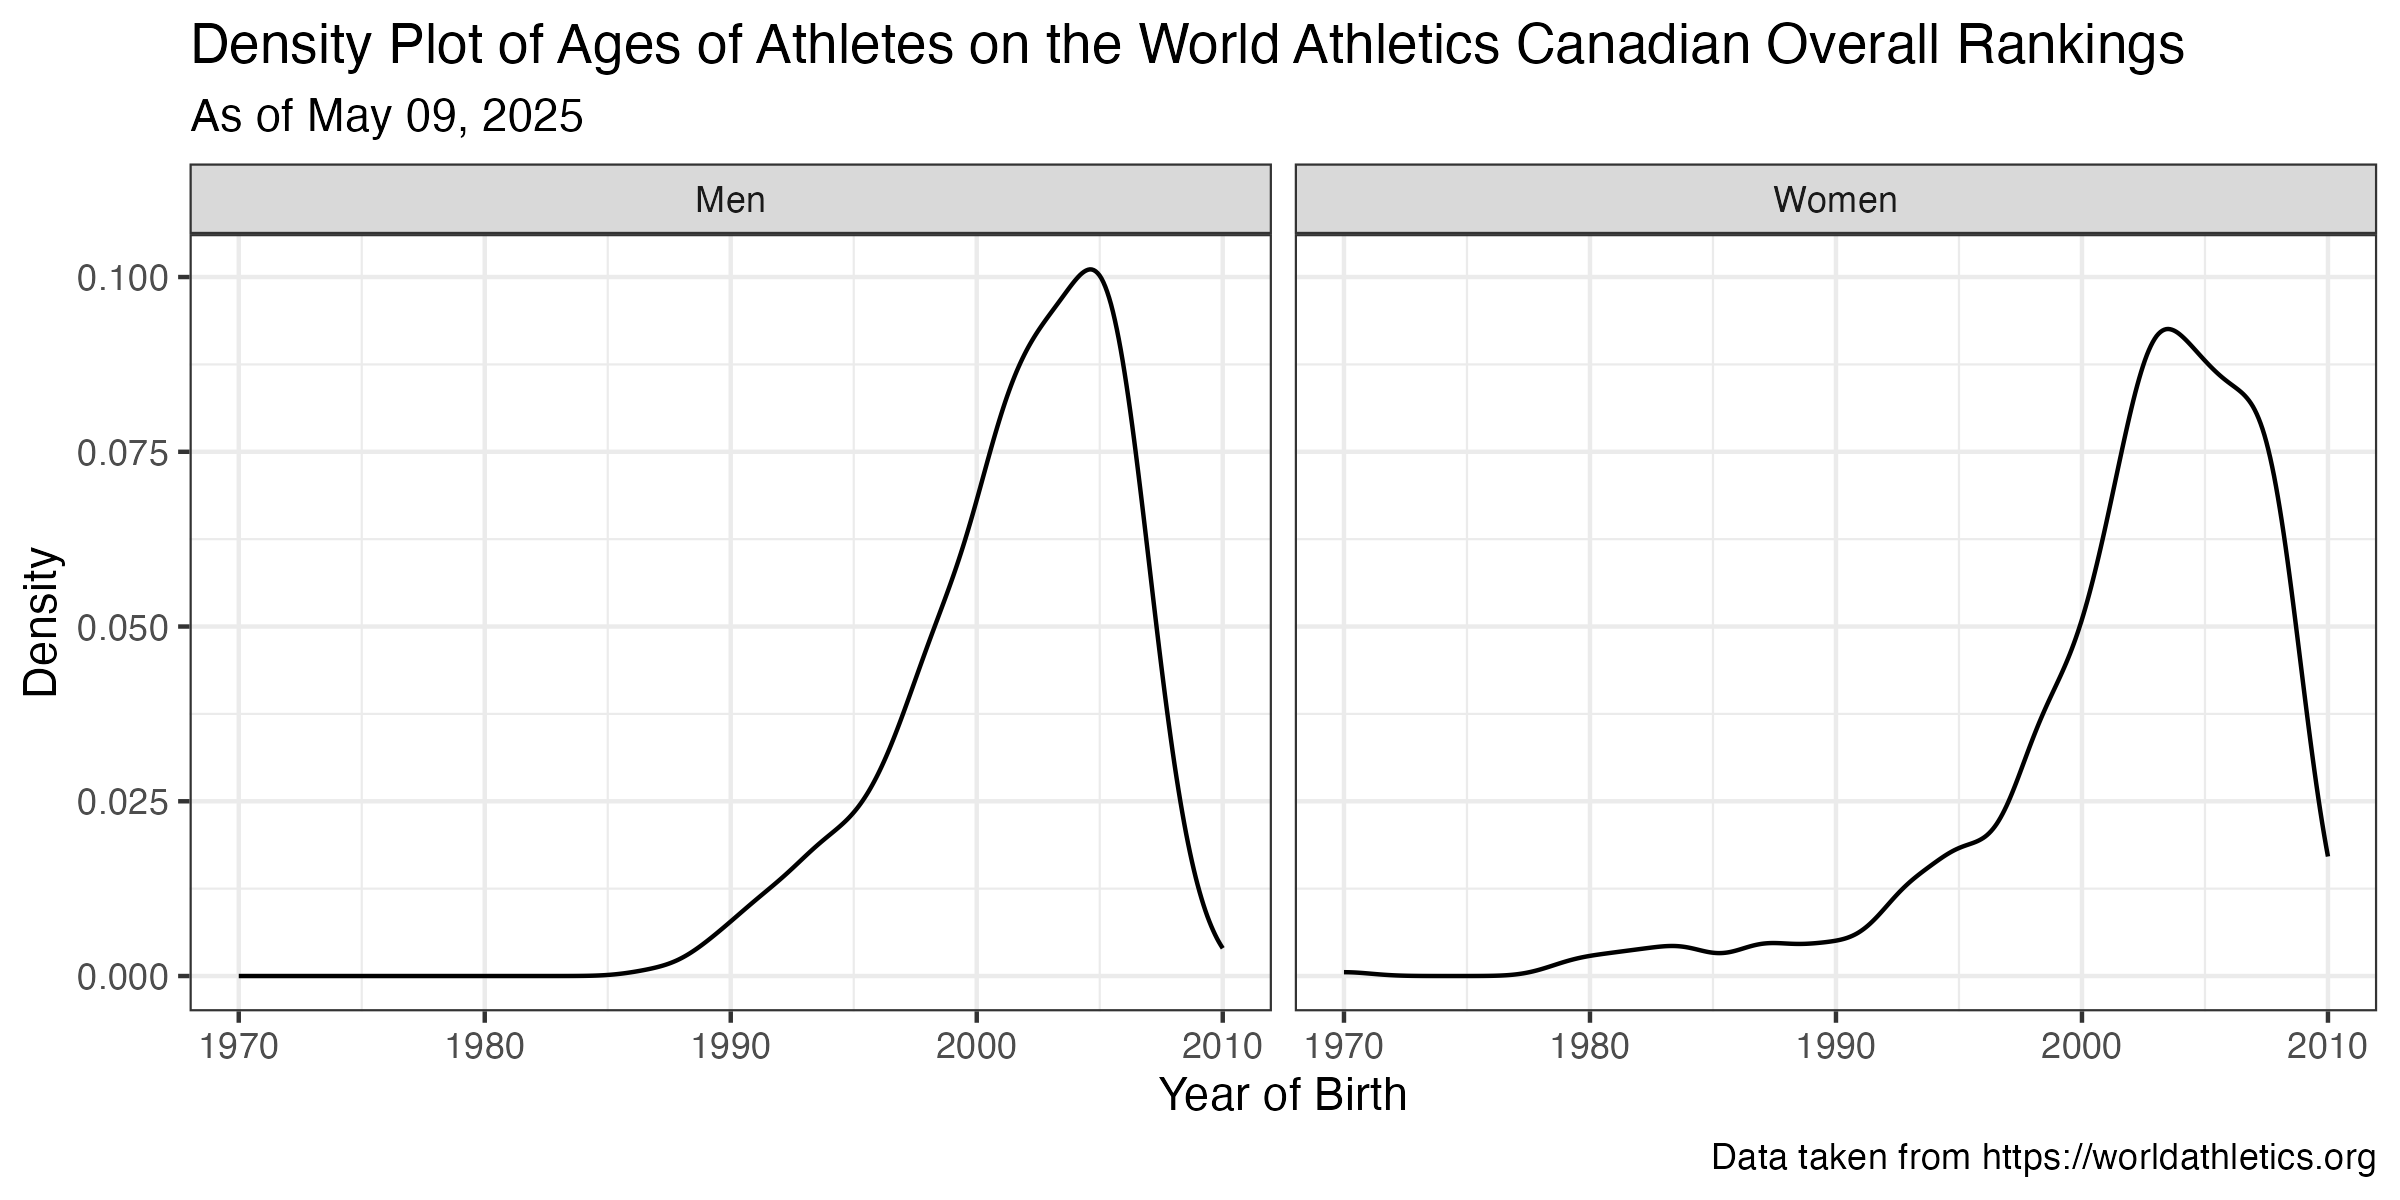
We can use a density plot to explore the distribution of athlete ages in the dataset
How has the information been visualized in analogous or adjacent use cases?
A scatterplot with a smoothed line of best fit are commnly used to visualize aging curves.
Visualization 1
ggplot2::ggplot(data = combined_table, mapping = ggplot2::aes(x = yob)) + ggplot2::geom_density() + ggplot2::labs(title ="Density Plot of Ages of Athletes on the World Athletics Canadian Overall Rankings", subtitle =paste("As of", format(Sys.Date(), "%B %d, %Y")),caption ="Data taken from https://worldathletics.org",x ="Year of Birth",y ="Density") + ggplot2::facet_wrap(~sex) + ggplot2::theme_bw()
Visualization 1
Visualization 2
ggplot2::ggplot(data = combined_table, mapping = ggplot2::aes(x = yob, y = score)) + ggplot2::geom_jitter() + ggplot2::geom_smooth() + ggplot2::labs(title ="World Athletics Canadian Overall Rankings", subtitle =paste("As of", format(Sys.Date(), "%B %d, %Y")),caption ="Data taken from https://worldathletics.org",x ="Year of Birth",y ="Score") + ggplot2::facet_wrap(~sex, scales ="free") + ggplot2::theme_bw()
Visualization 2
Model
Will this information be used to predict future outcomes, make inferences on past events, or describe the phenomena taking place?
Model
Will this information be used to predict future outcomes, make inferences on past events, or describe the phenomena taking place?
We are interested in describing the relationship between an athletes performance score and their age and sex, so we can build a generalized linear model and perform parameter inference on the coefficients.
Example Implementation in R
# Fit a linear regression modelmodel <-lm(score ~ yob +I(yob^2) + sex, data = combined_table)# Print the summary of the modelsummary(model)
Example Implementation in R
Model Fit
# Fit a linear regression modelmodel <-lm(score ~ yob +I(yob^2) + sex, data = combined_table)# Print the summary of the modelsummary(model)
Call:
lm(formula = score ~ yob + I(yob^2) + sex, data = combined_table)

Residuals:
    Min      1Q  Median      3Q     Max
-165.78  -52.95  -11.81   44.54  422.25

Coefficients:
              Estimate Std. Error t value Pr(>|t|)
(Intercept) -1.749e+06  1.989e+05  -8.789   <2e-16 ***
yob          1.757e+03  1.991e+02   8.822   <2e-16 ***
I(yob^2)    -4.411e-01  4.984e-02  -8.850   <2e-16 ***
sexWomen    -3.471e+00  4.860e+00  -0.714    0.475
---
Signif. codes:  0 '***' 0.001 '**' 0.01 '*' 0.05 '.' 0.1 ' ' 1

Residual standard error: 79.65 on 1140 degrees of freedom
  (32 observations deleted due to missingness)
Multiple R-squared:  0.1694,    Adjusted R-squared:  0.1672
F-statistic:  77.5 on 3 and 1140 DF,  p-value: < 2.2e-16
Communicate
Who are the stakeholders receiving the insights generated from this analysis?
What is the most sustainable medium for these insights to be shared?
How often will these insights be shared?
Communicate
Who are the stakeholders receiving the insights generated from this analysis?
Funding committees, coaches, athletes, and other senior leadership
What is the most sustainable medium for these insights to be shared?
Since there are a wide variety of stakeholders, a web-based static report is a desirable option.
How often will these insights be shared?
These insights will need to be shared weekly.
Possible Dissemination Avenues
For reporting documents, Quarto is highly recommended, as it can be used for many academic and technical report styles that involve results derived from data and has flexible publishing options.
For static reports in particular, publishing a Quarto document using GitHub Pages is particularly effective, since this can be done for free on public repositories (and on private repositories with a GitHub Pro account).
Extensions
Task Automation:
We noted earlier that rankings are updated weekly, so we want to leverage some sort of scheduler to automate the process of updates and report generation.
Data Storage:
If the dataset that we are collecting is large, scraping all of it when the document is rendered will be quite time consuming, as opposed to saving it remotely and loading it in at runtime. Can we do this for cheap/free?