Lecture 6
2025-06-16
Case Study: Data Solutions in Professional Sports
David Awosoga
Overview
In sport, data solutions are generally purposed to provide organizations with a competitive advantage over their opponents and are consequently tightly protected.
As a result, there is a marked disconnect between public knowledge of the state of sports analytics and the projects that organizations are doing behind closed doors, which are much better funded and have access to higher quality data and computational resources.
In this lecture you will be introduced to examples of data solutions utilized by professional sports organizations, with a focus on major league baseball.
Learning Objectives
By the end of this lesson, you will be able to:
- Understand different avenues that people can work in sports.
- Understand the technical and logistical requirements for creating industry-grade data solutions.
- Identify analogs to baseball data solutions in other sports.
- Formulate your own data solution idea and position it in a way that aligns with an organization’s desire to achieve a competitive advantage.
Prelude: How to Get a Job in Sports
- Freelance:
- Examples include working as an independent contractor, often on a project-by-project basis.
- In-house:
- Departments structures can vary, some examples are “Operations” and “Strategy & Analytics”.
- Third-party Company:
- Examples include Teamworks Innovations Intelligence and Sumer Sports.
What are some benefits and drawbacks of each employment type, from the perspective of an organization?
Discussion
Freelance:
Benefits: Flexible term-length, no provision of benefits
Drawbacks: Onboarding overhead, frequent turnover
In-house:
Benefits: More control over long term projects
Drawbacks: Higher costs due to benefits and incentives
Third-party:
Benefits: Greater scaling and breadth capacity
Drawbacks: Coordination and integration challenges
What are some benefits and drawbacks of each employment type, from the perspective of the employee?
Discussion
Freelance:
Benefits: Flexibility, project variety
Drawbacks: Uncertainty in contract frequency
In-house:
Benefits: “Dream job”, organization-specific perks
Drawbacks: “Passion tax”, irregular work hours
Third-party:
Benefits: Most lucrative and stable
Drawbacks: Furthest separation from team operations
Background
There are several types of sports analytics data solutions, including:
Open-source: Uses publicly accessible data to generate publicly accessible insights
Academic: Uses publicly accessible or proprietary data to generate publicly accessible insights
Internal: Uses publicly accessible or proprietary data to generate private insights.
Sports organizations primarily leverage internal sports analytics data solutions.
Shrouded in Mystery
The specific analytical tools utilized by organizations are often not publicly disclosed, and therefore people “one the outside” typically have little insights about the specific service offerings and use cases of these data solutions.
However, since it is advantageous for third-party firms to advertise their services to teams, they often share high-level information about the products they offer.
Case Study: Zelus Analytics (Teamworks Intelligence)
History
- Zelus Analytics was founded in 2019 by Luke Bornn, Dan Cervone, and Doug Fearing.
- Initially beginning in basketball analytics, they quickly expanded to baseball and soccer, combining their analytics expertise with professional sports experience.
- They provide advanced analytics and strategies for athlete health and performance optimization, and have raised nearly 4 million in its Series A funding round.
- Zelus was acquired by Teamworks in 2024, where their Titan Intelligence Platform has been integrated into a comprehensive analytics engine with other SaaS products.
Staffing
Building off of the extensive academic experience of the founders, research is a core service that they offer, and at one point nearly a third of their team had a PhD. Their quantitative division is primarily comprised of:
Data engineers
Back-end software developers
Analytical specialists (advanced degrees)
Analytical generalists (industry experience)
All staff members are signed to non-compete clauses and proprietary information agreements.
Technical Requirements
Apply best-in-class techniques from statistics, machine learning, computer vision, simulation, optimization, and data visualization.
Perform validation, testing, and manual quality assurance before certifying new models and metrics for team use.
Maintain separation of proprietary team data sources while training statistical models and creating the corresponding predictions.
Industry standard data encryption, backup, and redundancy features to ensure data integrity and security.
Titan Intelligence
“[Titan Intelligence] provides proprietary baseball analytics models and metrics that inform critical baseball operations decisions, including
- player evaluation,
- prospect assessment,
- trade analysis,
- roster construction,
- asset valuation, and
- on-field strategy.
Titan Intelligence
These exclusive analytical tools give the team’s front office a competitive advantage when determining
player acquisition strategy,
making personnel decisions,
optimizing roster value, and
maximizing on-field performance.
… [These] models and metrics are accessible to the Club through a dedicated, cloud-hosted data warehouse and a set of cloud-hosted web APIs.”
Wait a second ….
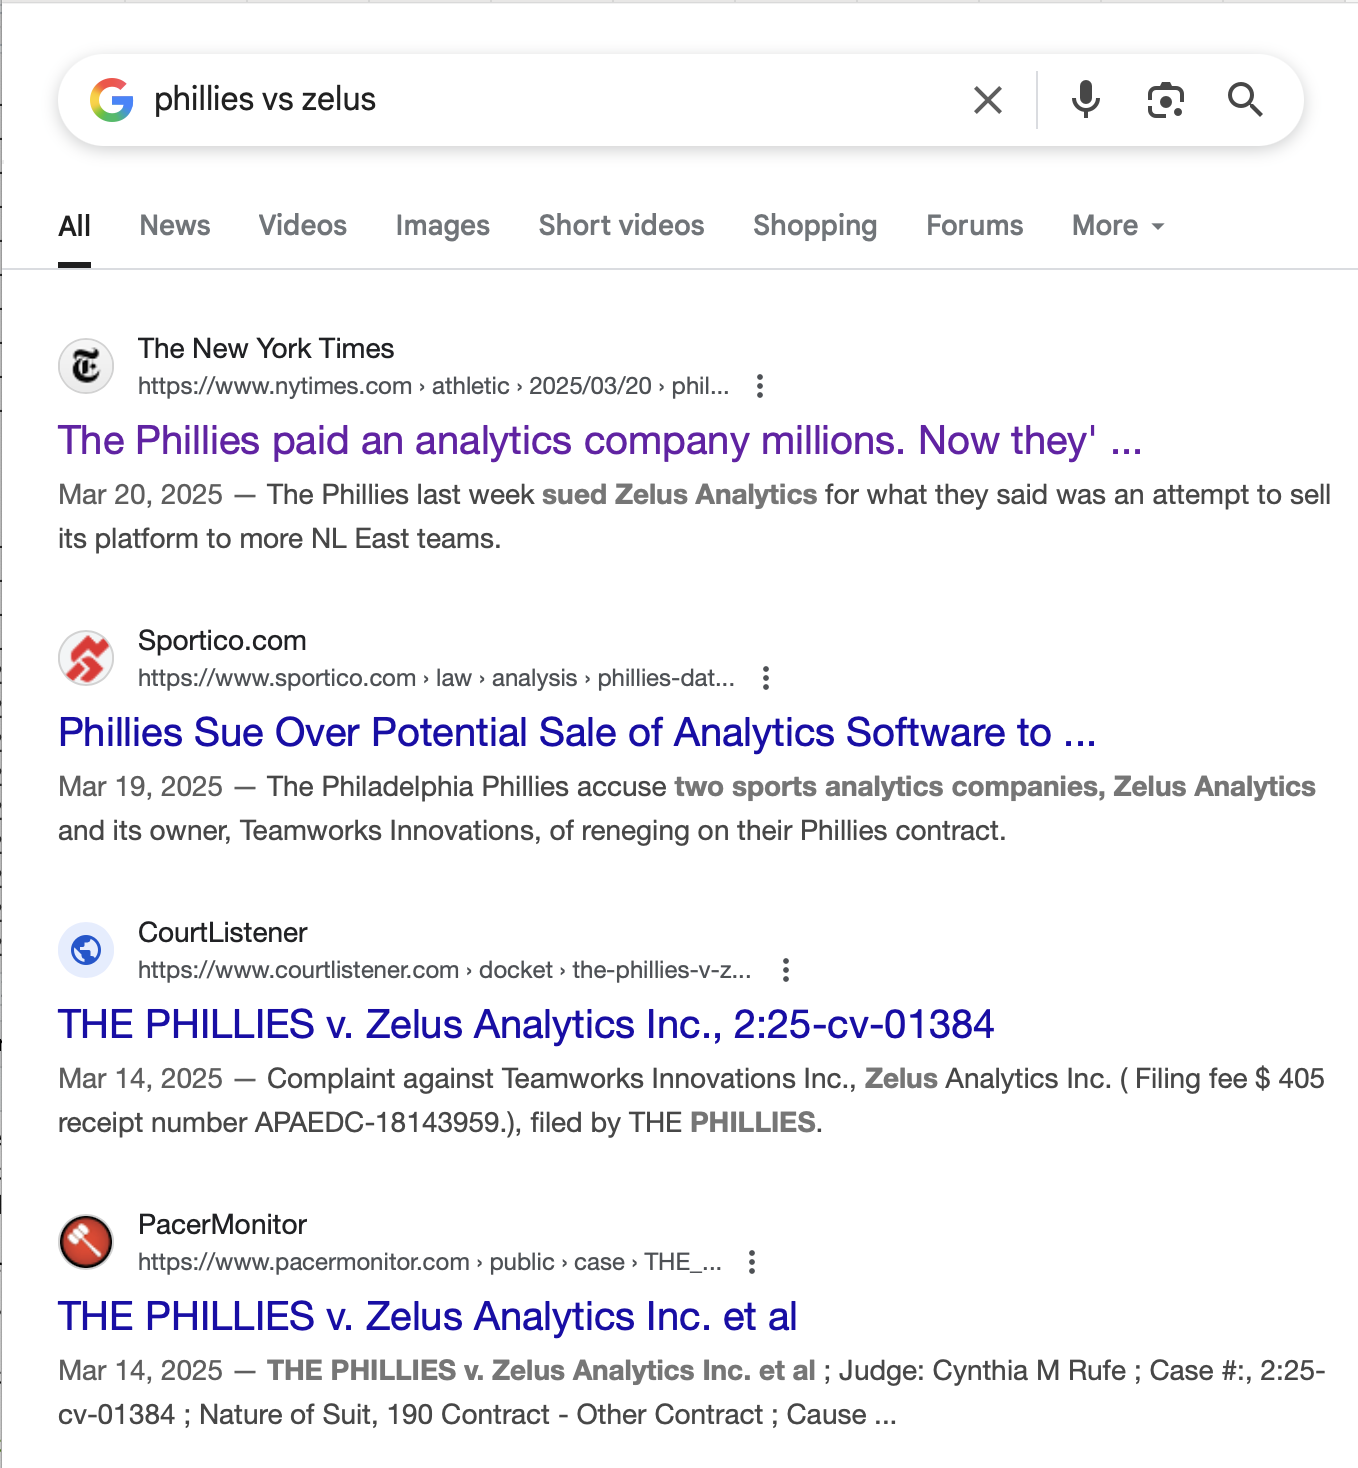
Isn’t this information supposed to be top secret? How do we know all this?
The Tea
The Tea
- In March 2025, the Philadelphia Phillies filed a lawsuit against Zelus Analytics, claiming the following counts:
- Breach of contract
- Breach of implied covenant of good faith and fair dealing
- Promissory estoppel
- Tortious interference with contract
The Timeline
Phillies sign with Zelus Analytics in 2022 for $600k.
They sign a 2-year contract extension in 2023 worth $1.3 million, with a $725k team option for the 2025 season.
Contract stipulations state that Titan Intelligence can only be provided to 1 team per division, a maximum of 6 total.
Phillies exercise their team option on February 14, 2025
Zelus tries to alter the scope by attempting to sell individual parts of Titan Intelligence to MLB teams at large, which the Phillies argue violates the existing exclusivity agreement.
The Case for Exclusivity
The Phillies claim that the restriction of Titan Intelligence being only available to one team per division is a key component of the contract, stating that:
“This limitation ensures that The Phillies maintain a significant competitive advantage in talent evaluation, player development, and strategic decision-making within both their division and across MLB as a whole.”
The phrase “competitive advantage” is referenced nine times in the suit. That’s how strongly the Phillies emphasized the value of the analytical tools provided by Zelus, but not only the tools, but also the exclusivity of them.
The Case for Exclusivity

Deliverables
For each deliverable, consider the following questions:
How can it be created?
How can it be applied to different sports?
What topics have we covered related to these items?
Deliverables
Automated ETL processes for ingesting Club data feeds and creating a unified data view within a secured, cloud-hosted PostgreSQL database (with a planned transition to a BigQuery data warehouse to support ad-hoc analysis).
Daily within-season updates for reference data and value metrics and weekly updates for rest-of-season projections and career value simulations.
- Updated data will be flagged within the client database/data warehouse to support efficient ingestion by Club.
Deliverables
- Hierarchical spatial models that predict batted ball outcome probabilities as a function of TrackMan/Hawk-Eye batted ball characteristics and game context with batter and baserunner speed effects. Customized predictions are available via API.
- Hierarchical spatial models that predict pitch outcome probabilities and resulting pitch quality as a function ofTrackMan/Hawk-Eye pitch trajectories and game context with individualized batter- and pitcher-specific spatial effects. Customized predictions are available via API.
Deliverables
- Park calibration models for pitch trajectory data to support integration of minor league TrackMan and Hawk-Eye data in spatial pitch outcome models.
- Pitcher-specific pitch class probabilities based on Gaussian mixture models fit to transformed pitch characteristics data. This transformation provides robustness against environmental effects, stadium-level miscalibrations, and variation in release point.
- Pitch-level stuff grades to isolate the value of pitch release characteristics by averaging the predicted pitch quality over a simulated distribution of pitch locations.
Deliverables
- Attribution strategies that credit (debit) the players involved in every pitch or ball-in-play event according to their contributions to the outcome of the play, covering pitching, hitting, fielding, base running (batted balls, steal attempts, and pick-offs), and other areas of pitcher/catcher run prevention (steal attempts, pick-offs, errant pitches, and catcher framing).
- These strategies incorporate a suite of hierarchical predictive models to standardize play- and pitch-level outcomes to a consistent run value scale and to adjust for contextual factors such as park effects, game situation, and quality of competition.
Deliverables
- Hierarchical spatial models that predict player and team out probabilities based on batted ball trajectory and fielder starting positions with individualized fielder spatial effects to measure probabilistic infielder and outfielder range. Customized predictions are available via API to support fielder positioning.
- Hidden Markov model that provides probabilistic, multi-year projections for the number of games a player will be available to play (not injured) given his injury and playing time histories, age, and position. Customized predictions are available via API.
Deliverables
- Dynamic linear models that provide probabilistic, multi-year projections for a player’s true talent given his age and performance history. The skill projections span all sources of player value, including pitching (overall and by pitch type), hitting (overall and by pitch type), fielding, baserunning, and other areas of pitcher/catcher run prevention.
- Extensions to multi-year pitching and hitting projections to incorporate NCAA DI performance data from College Splits and TrackMan. Play-level results are adjusted to account for park and quality of competition as measured by each player’s conference, team, and opponents faced.
Deliverables
- Policy-based simulation model that combines sampled player availability and true talent skill projections with rational roster management and player usage assumptions to produce total and surplus value projections for a player’s tenure. Uses an API to control parametric assumptions and perform sensitivity analysis.
- Situation-neutral batter/pitcher matchup projections (coarse play outcomes plus expected run values) utilizing true talent skill components from pitching and hitting projections (overall and by pitch type). Matchup projections are available via API for game planning and matchup card creation.
Deliverables
- Zone-based spatial visualizations of pitcher-, batter-, or matchup-specific pitch outcomes to support game planning and review, including catcher pitch calling and batter swing decision making. Pitch outcome visualizations are available via API.
- Research web portal that provides methodological details on all key modeling components of our platform, including diagnostics on the performance of predictive models in comparison with reasonable alternatives.
- Extensions to fielding and baserunning projections to incorporate Statcast metrics and Zelus metrics constructed using out probability models.
Group Activity
Group Activity
In pairs, spend some time brainstorming a data solution that could be provided to a professional sports team. Use the data science workflow (import, tidy, transform, visualize, model, communicate) to guide your discussion.
- Amateur Projections
- Kinematics
- In-Game Management Tools
- Pro Projections
- Engineering Infrastructure
- Exploratory Analysis
Amateur Projections
- College player projections, including pro asset values.
- Pitch/contact quality metrics for high school and international amateur.
- Inclusion of prospect lists in amateur projection priors.
- Ingestion, mapping and processing of summer league data.
- Improved player mapping incorporating additional player information sources (e.g., FanGraphs, Baseball Reference).
- Addition of college fielding and baserunning projections.
- Enhancements to underlying model-derived inputs.
Kinematics
- Ingestion, processing, and hosting of pitcher and batter kinematic data from Hawk-Eye and KinaTrax available through the MLB Data Sharing Platform.
- Featurization of pitcher and batter kinematic data at the pitch and swing level.
- Swing quality metrics based on kinematic and non-kinematic datasets to be incorporated in batter projections.
Pitching and Fielding
- Additional fielder positioning tools that are park- and matchup-specific.
- Projected matchup spray distributions and visualizations via API.
- Enhancements to league-average and player-specific fielder range models.
- Refinements to spatial pitch outcomes model.
Fielding & In-Game Management Tools
- Additional tools to support calculation of matchup-level expected runs saved based on proposed fielder positioning.
- Extension of fielding evaluation stack to support minor league fielder positioning data available from Hawk-Eye and TrackMan through the MLB Data Sharing Platform.
- Simplified API to support full series preparation, and API endpoints for each individual tool and matchup.
- Enhancements to pitch outcome visualizations, including individual pitch type breakdowns and additional formatting options.
MLB Projections
- Contextualized performance projections including translations to traditional stat lines.
- Roster depth and player flexibility evaluation tools.
- Predictive smoothing of contact and pitch quality measures.
- Improved prior structure for batter and pitcher projections.
- Adjustments to asset value simulation policies to incorporate CBA-related changes.
Pro Projections
- Additional outcome measures and component skills to more stably estimate lower-level performance.
- Projection explainability reports incorporating component-level breakdown of projected value and historical development trends.
- Playing time predictions for asset value calculations.
- Addition of injury types to improve availability projections.
- Full suite of value attributions and league-specific projections for NPB and KBO.
Engineering Infrastructure
- Ingestion, processing, and hosting of pitcher and batter kinematic data from Hawk-Eye.
- Overnight exports for game results and value metrics.
- Additional tables, views, and APIs to simplify the presentation of aggregated metrics.
- Game-level compute workloads to improve robustness and support quicker turnaround of MLB games.
- Refined player mappings to automate the merging of pro and college players.
- Generalized game and event schemas to support the integration of multiple play- and pitch-level data sources.
Exploratory Analysis
- Exploratory analysis of new data sources to identify future modeling opportunities, including batter kinematics, pitcher kinematics, and derived features from high-speed video and center field video feeds (using computer vision techniques).
- Automated change detection for performance metrics and player kinematic features.
- Inclusion of MLB-provided weather data in batted ball outcome predictions.
- Pitcher command analysis through computer vision applied to center-field video.
Resources
- Analyzing Baseball Data with R (3e) - Jim Albert, Ben Baumer, and Max Marchi
- Introduction to NFL Analytics with R - Brad Congelio
- Machine Learning in Sports - Keisuke Fujii
- Soccer Analytics Reviews - Jan Van Haaren
- Fantasy Football Analytics: Statistics, Prediction, and Empiricism Using R - Isaac T. Petersen
- Basketball Data Science with Applications in R - Paola Zuccolotto & Marica Manisera
Next Up
- Module 4: Web Applications and Dashboards
- DO4DS: 7-12
- Project presentation proposals: Due July 14 @ 11 AM on Crowdmark

STAT 468 - Introductory Sports Performance Analysis